How Weather Increases Your Bill
Understanding the Ups and Downs of your Electric Bill
Weather is one of the most important factors influencing your electricity consumption. Variations in weather and how you heat and cool your home or business can dramatically increase your monthly electricity bill. One way to account for the monthly impact of weather is to use “Degree Days” to compare a monthly bill to the same month from previous years.
Degree Days assume when the outside temperature is 65°F, we do not need heating or cooling to be comfortable. Degree Days are the difference between the daily temperature mean (high temperature plus low temperature divided by two) and 65°F.
If the temperature mean is above 65°F, we subtract 65 from the mean and the result is “Cooling Degree Days” (CDD). If the temperature mean is below 65°F, we subtract the mean from 65 and the result is “Heating Degree Days” (HDD).
Your electricity consumption is billed monthly and depending on the season, the daily heating or cooling degree days are added together for each month or billing period.
The daily Heating or Cooling “Degree Days” are separately added together, starting with the first day of the monthly bill period, through the last day of the monthly bill period. A typical monthly bill period is 28-31 days, so you add up all the "Heating Degree Days" in the winter months and all the “Cooling Degree Days” in the summer months. The total number of "Degree Days" in one month are then compared to the same month from the previous year to see how much colder or hotter it was. This is a convenient way to measure weather-related electricity usage, season to season.
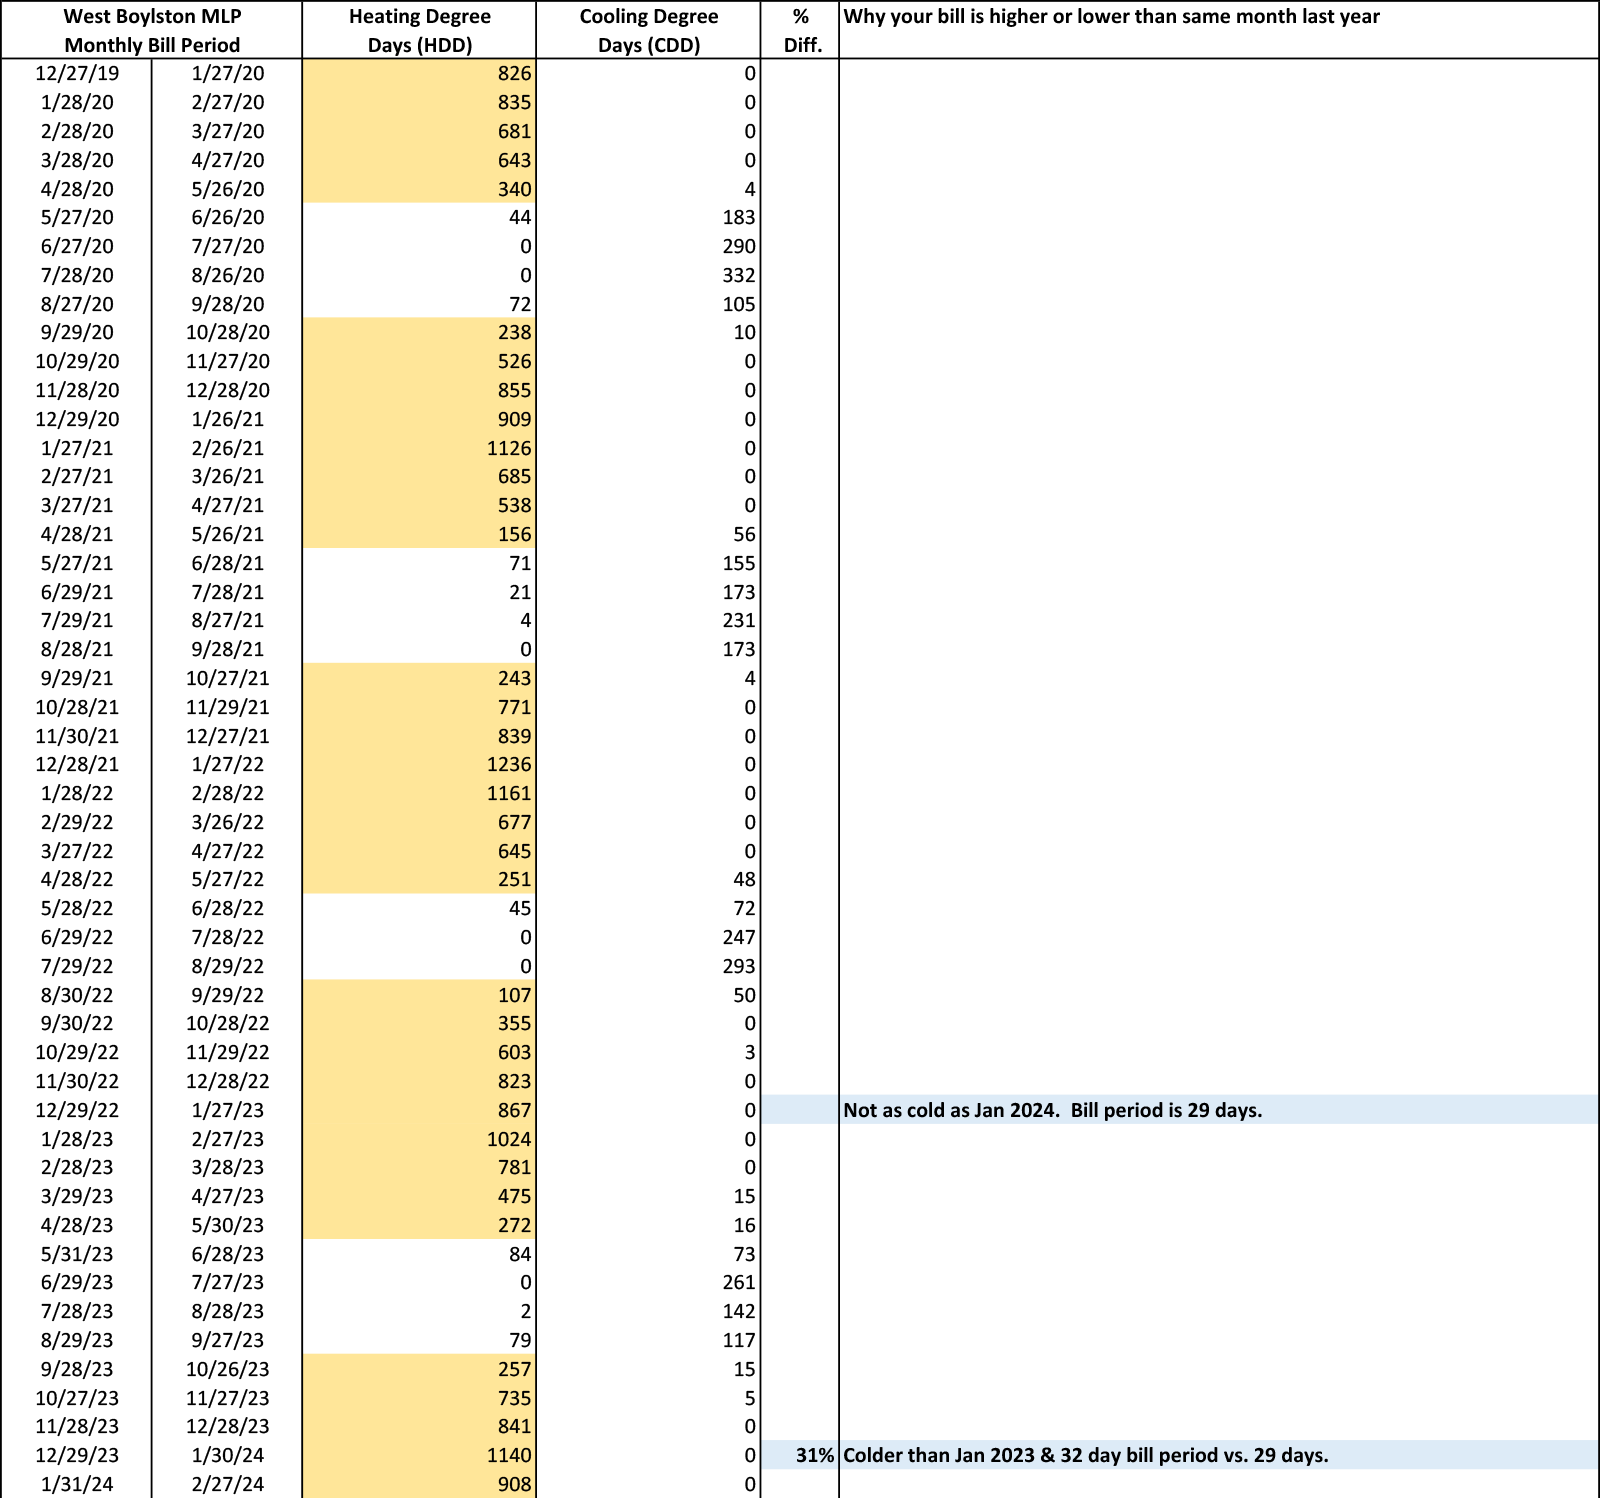
Recent Local Heating & Cooling Degree Day Chart

Do you have a High Electric Bill?
Customers usually call us when their current electricity bill is much higher compared to last month or the same month last year. Knowing and comparing the total number of Heating and Cooling Degree Days in each month provides one possible explanation of why your electricity bill is higher or lower.
Here are two weather related examples from the chart above of the actual degree days for Worcester, MA, that might result in high electricity consumption by our customers.
In February 2021 there were (1,126) Heating Degree Days. In February 2020, there were only (835) Heating Degree Days. There were 35% more Heating Degree Days in February 2021 compared to February 2020. This means it was much colder in February 2021 compared to February 2020, and this usually results in customers consuming a lot more electricity.
The second example occurred in January 2022. In January 2022, there were (1,236) Heating Degree Days. In January 2021, there were only (909) Heating Degree Days. There were 36% more Heating Degree Days in January 2022 compared to January 2021, since it was so much colder in January 2022. This typically translates into a higher electric bill due to increased usage in colder months.
Vacations: Another typical reason why a monthly electricity bill increases is from children home all day during extended vacations or during COVID. Children tend to use more devices and appliances, leave lights, devices, and appliances on, and turn the heat or cooling up all day long while they're home.